Guide to Network Analysis in Net.Create
This section is meant to help users who are new to working with networks and answer questions such as how to interpret the visualization, how to think about what data to input, and how to think about node & edge types.
Understanding Networks
At its most basic level, a network displays points of data and the connections between them. This allows users to discover otherwise difficult-to-discern patterns and connections within a data set.
Nodes, Edges, and Gravity
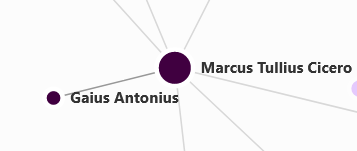
In the network visualization, the size of nodes is influenced by the number of connections the node possesses; the more connections a node has, the larger it is displayed.

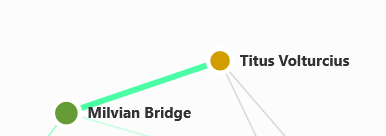
Similarly, the size of edges can be larger or smaller depending on the intensity/frequency of the connection.
- Note that this does not happen automatically but must be tracked by the user.

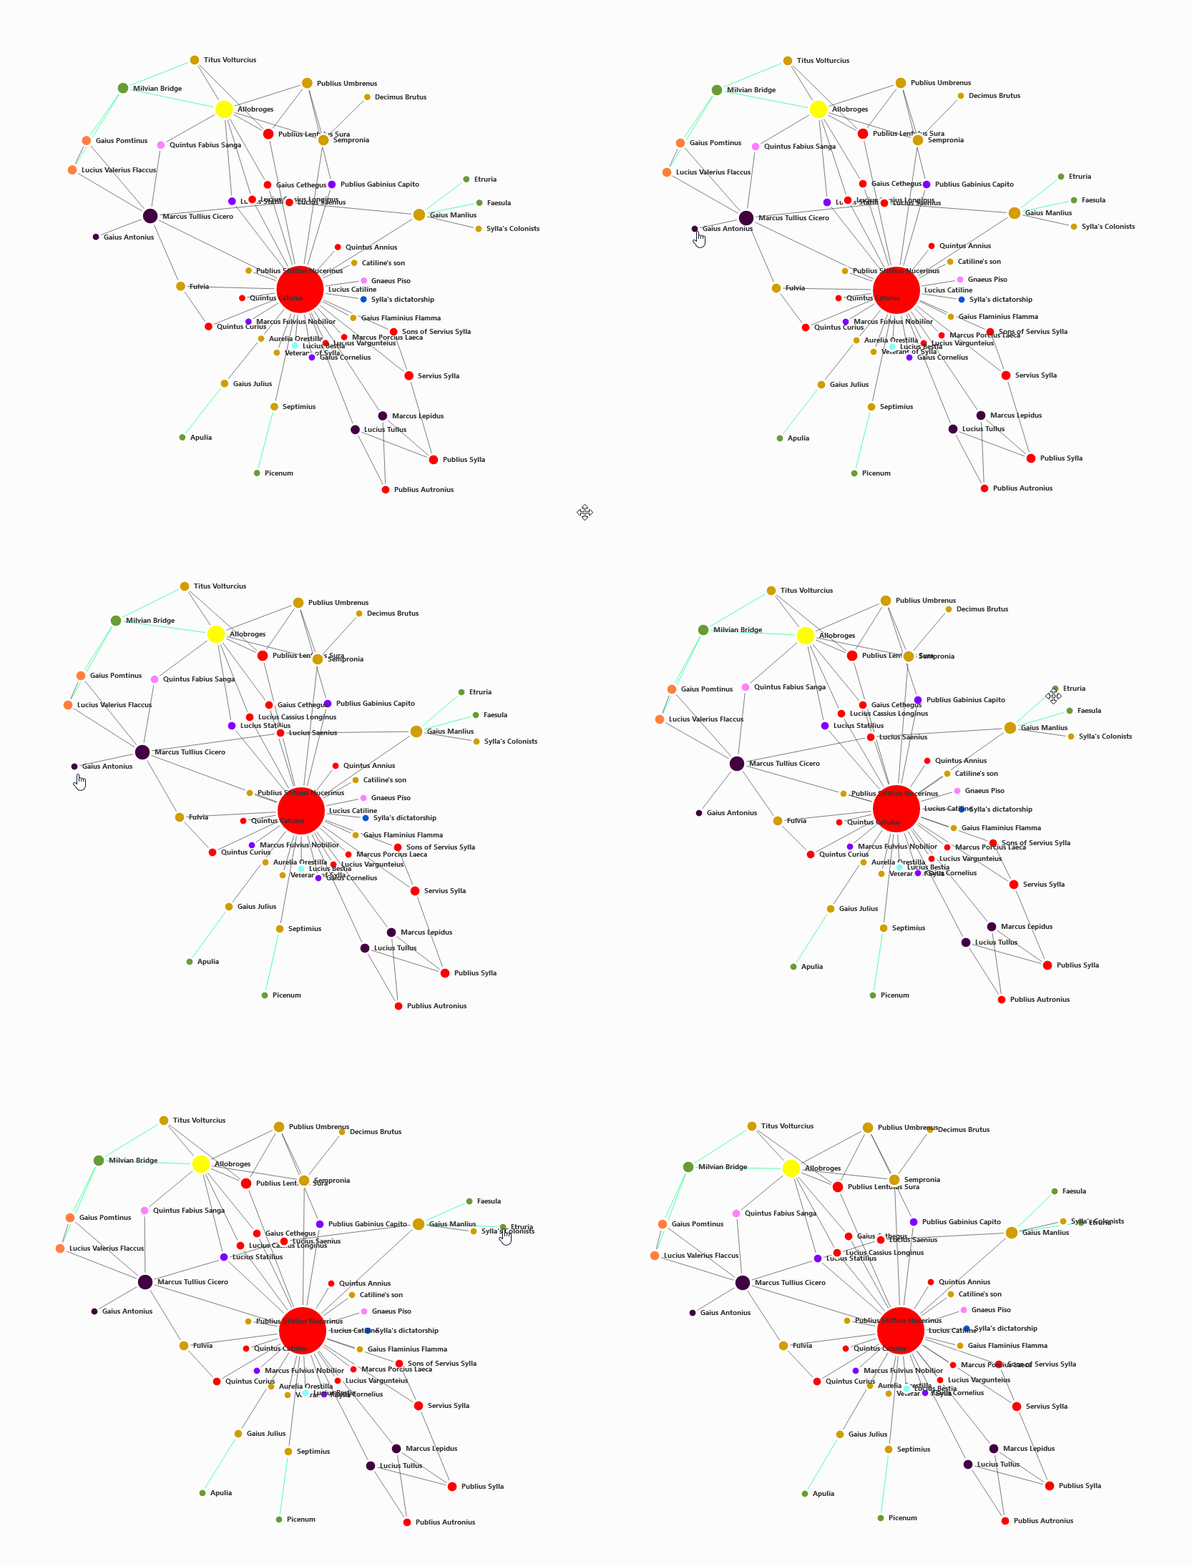
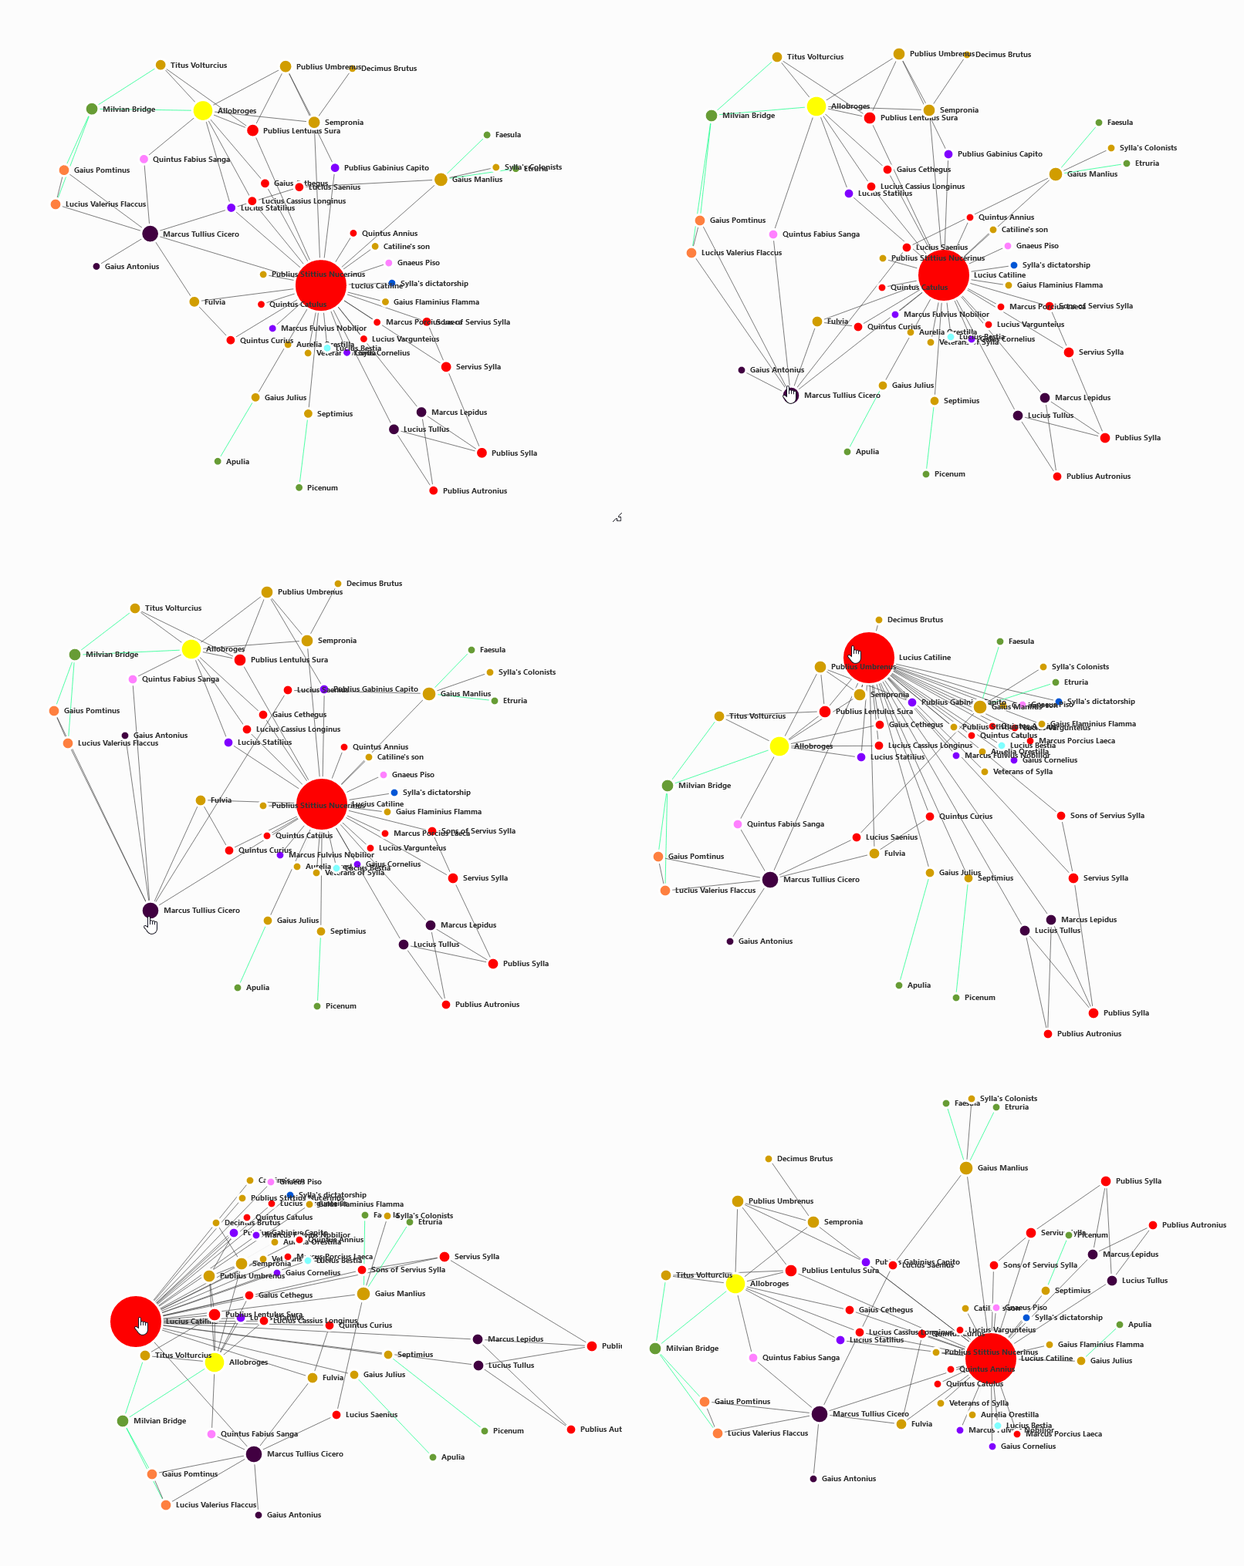
Because of these properties, just like physical objects, the data in the network acquires “gravity.” Manipulating a small, non-central node has only a minor effect on the entire network,

but manipulating a larger, more central node has greater effects.

 Net.Create Documentation